Demographics
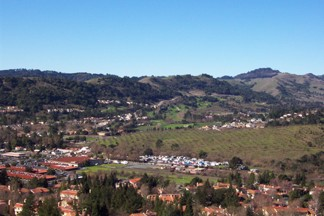 General Facts
- Average High Temperature
- Coldest month - January: 36 to 53° F
- Warmest Month - September: 53 to 80° F
- Average Annual Rainfall: 26.86 inches
- Average Home Price as of January 2025: $1.4 M
- Total Town Area: 9.54 square miles
Land Use Acreage in Moraga
This data is based on uses depicted on the 2040 Moraga General Plan.
| Land Use Category | # of Parcels | Acres | Percent of Total Acreage |
|---|---|---|---|
| Residential | 5,536 | 2,016.2 | 32.6% |
| Rural (5 acres+) | (10) | (80.8) | (1.3%) |
| Single-Family Detached | (3,996) | (1,684.3) | (27.2%) |
| Single-Family Attached | (1,490) | (222.3) | (3.6%) |
| Multi-Family | (40) | (28.8) | (0.5% |
Commercial | 77 | 108.0 | 1.7% |
| General | (47) | (80.8) | (1.3%) |
| Office | (26) | (16.9) | (0.3%) |
| Legacy Commercial Ag | (4) | (10.3) | (0.2%) |
Open Space | 373 | 2,824.3 | 45.7% |
| Agricultural/Rangeland | (178) | (1,842.4) | (29.8%) |
Public Open Space/Parks | (32) | (509.1) | (8.2%) |
| Common Open Space | (163) | (472.8) | (7.6%) |
Other | 151 | 679.8 | 11.0% |
| Public Facility/Institutional | (31) | (517.2) | (8.4%) |
| Utility | (15) | (13.7) | (0.2%) |
| Vacant | (105) | (148.9) | (2.4%) |
| Transportation Rights-of Way | N/A | 556.7 | 9.0% |
TOTAL | 6,137 | 6,185.0 | 100.0% |
Source: Barry Miller Consulting, Town of Moraga, 2024
Demographics
| Year | Population | Single Family Homes | Total Housing Units |
|---|---|---|---|
| 1974 | 14,418 | 3,081 | 4,484 |
| 1980 | 15,014 | 3,364 | 4,986 |
| 1990 | 15,852 | 3,791 | 5,562 |
| 1995 | 16,308 | 3,886 | 5,737 |
| 2000 | 16,290 | 3,894 | 5,760 |
| 2010 | 16,016 | 3,897 | 5,754 |
| 2020 | 16,870 | ||
| 2025 | 16,637 | 5,978 |
Census Bureau Information
See the U.S. Census Bureau website for up-to-date demographic information for Moraga, California.